
Finding the right data meant asking around
Data was spread across teams and tools. Finding a dataset, checking whether it could be trusted, or seeing where a number came from meant filing a ticket and waiting for an engineer.
Symbiontra
Big companies have data scattered across dozens of teams and tools. I designed Symbiontra: one place where anyone can find a dataset, see where it came from, and ask it questions, in SQL or plain English.
Every team was supposed to own its data, but in practice almost everything still went through one central engineering team. Finding the right dataset, trusting it, or knowing where a number came from meant filing a ticket and waiting.
Symbiontra treats each dataset as a product on a shelf, with an owner, a version and a history. Teams can create, publish, find and use those data products on their own, while shared rules keep everything trustworthy.
This is the story of how a company's data stopped being a maze only engineers could find their way through, and became something every team could find, trust and use on its own.
Data was spread across teams and tools. Finding a dataset, checking whether it could be trusted, or seeing where a number came from meant filing a ticket and waiting for an engineer.
The data existed. What was missing was a way to see it as something ready to use, with an owner, a label and a history.
Symbiontra puts every data product in a searchable catalog, shows where it comes from and who relies on it, and lets anyone ask questions in SQL or plain English.
Big companies have data everywhere: sales, supply, operations, finance. Traditionally one central data team looked after all of it. A Data Mesh flips that: each team looks after its own data and shares it with the rest of the company, like a product on a shelf.
Think of a Data Mesh as a farmers' market instead of one big supermarket. Each stall grows and sells its own produce, with a label saying who made it, what's in it and how fresh it is. Symbiontra is the market itself: the stalls, the signs and the rules everyone follows.
The team that creates the data looks after it, not a distant central team.
Every dataset comes with an owner, a version, a description and a quality score, like the label on a jar.
Teams can publish and use data on their own, without being infrastructure experts.
Shared rules keep everyone's data trustworthy, even though no single team owns it all.
Daniel owns a dozen data products for his company's subsurface team. He knows his data better than anyone, yet he still can't answer simple questions about it without help. Here's how one simple question played out.
“Which version of your well data should I use for the monthly report?”
It lists the tables, but not which version is current or who else uses it.
The lineage diagram on the wiki is months out of date, so only an engineer can say what feeds the dataset.
An upstream source changed last week, and nobody downstream was told.
Two reports already shared with the business have to be redone.
Three days, three people and one ticket for a single question.
An illustrative scenario, pieced together from the frustrations people described in research.
Three roles came up around every data product. Daniel owns it. Ana, a data engineer, builds the pipelines behind it. Kofi, a business analyst, uses it to make decisions.
Data Product Owner
Energy data provider · subsurface domain
I own this data, but I still need an engineer to tell me who uses it and what feeds it.
Data Engineer
Platform team · supports 4 domains
I build the pipelines, then spend the rest of the week explaining them.
Business Analyst
Commercial domain · data consumer
I can't tell which dataset is the right one, so I ask — and then I wait.
Daniel is the primary persona; Ana and Kofi are secondary.
Each person needed a different view of the same data product: technical depth for Ana, plain clarity for Kofi, and a sense of ownership for Daniel. One product, three lenses.
On paper, every team owned its data. In practice, almost everything still had to go through one central engineering team.
The data was spread out, but the keys to it were not. Every question, every new dataset and every fix still waited in the same engineering queue.
How might we let every team find, publish, trust and use data products through one platform, without waiting on a central team?
I followed data products from the people who create them to the people who use them, looking for every point where someone had to stop and ask an engineer.
The same frustrations came up from every side of the data. Paraphrased from the interviews:
“I can't tell which datasets exist, or which version to trust.”
“Only the engineers know where this data really comes from.”
“Every new question means writing SQL, or asking someone who can.”
“To understand one dataset, I jump between several tools.”
“I only hear about quality problems when someone complains.”
“We can't publish anything without the central team.”
The Data Mesh was a good idea about how teams should work, but nobody had built the screen for it. People needed one place where every data product could be found, understood, traced and questioned.
I looked at everything teams were already using to work with data. Each tool handled one step well, and none of them connected the steps around the idea of a data product.
| Approach | Good at | What's missing | Verdict |
|---|---|---|---|
| Data catalogsDiscovery | Listing and describing datasets. | Exploring, querying or running them. | Partial |
| Central data teamTicket queue | Reliable expertise. | Speed. Every request waits in the same queue. | Bottleneck |
| SQL & notebook toolsExploration | Powerful questions, for people who can code. | Anything a business owner can use. | Narrow |
| Custom pipelines & scriptsDIY | Flexibility. | Documentation, stability, and visibility for the people using the data. | Fragile |
| SymbiontraThis project | The whole journey: find, explore, trace and query a data product in one place. | No split between business and engineering. Both use the same screens. | Opportunity |
Put the data product, not the table or the pipeline, at the centre of the experience, and build every tool around it.
Each big decision came straight from research. Here's what we noticed, what we could have done, and what we chose.
We noticed: people don't think in databases and tables. They think “I need the sales forecast”. So everyone starts from a searchable catalog of data products, each card showing who publishes it, which version it is and how usable it is.
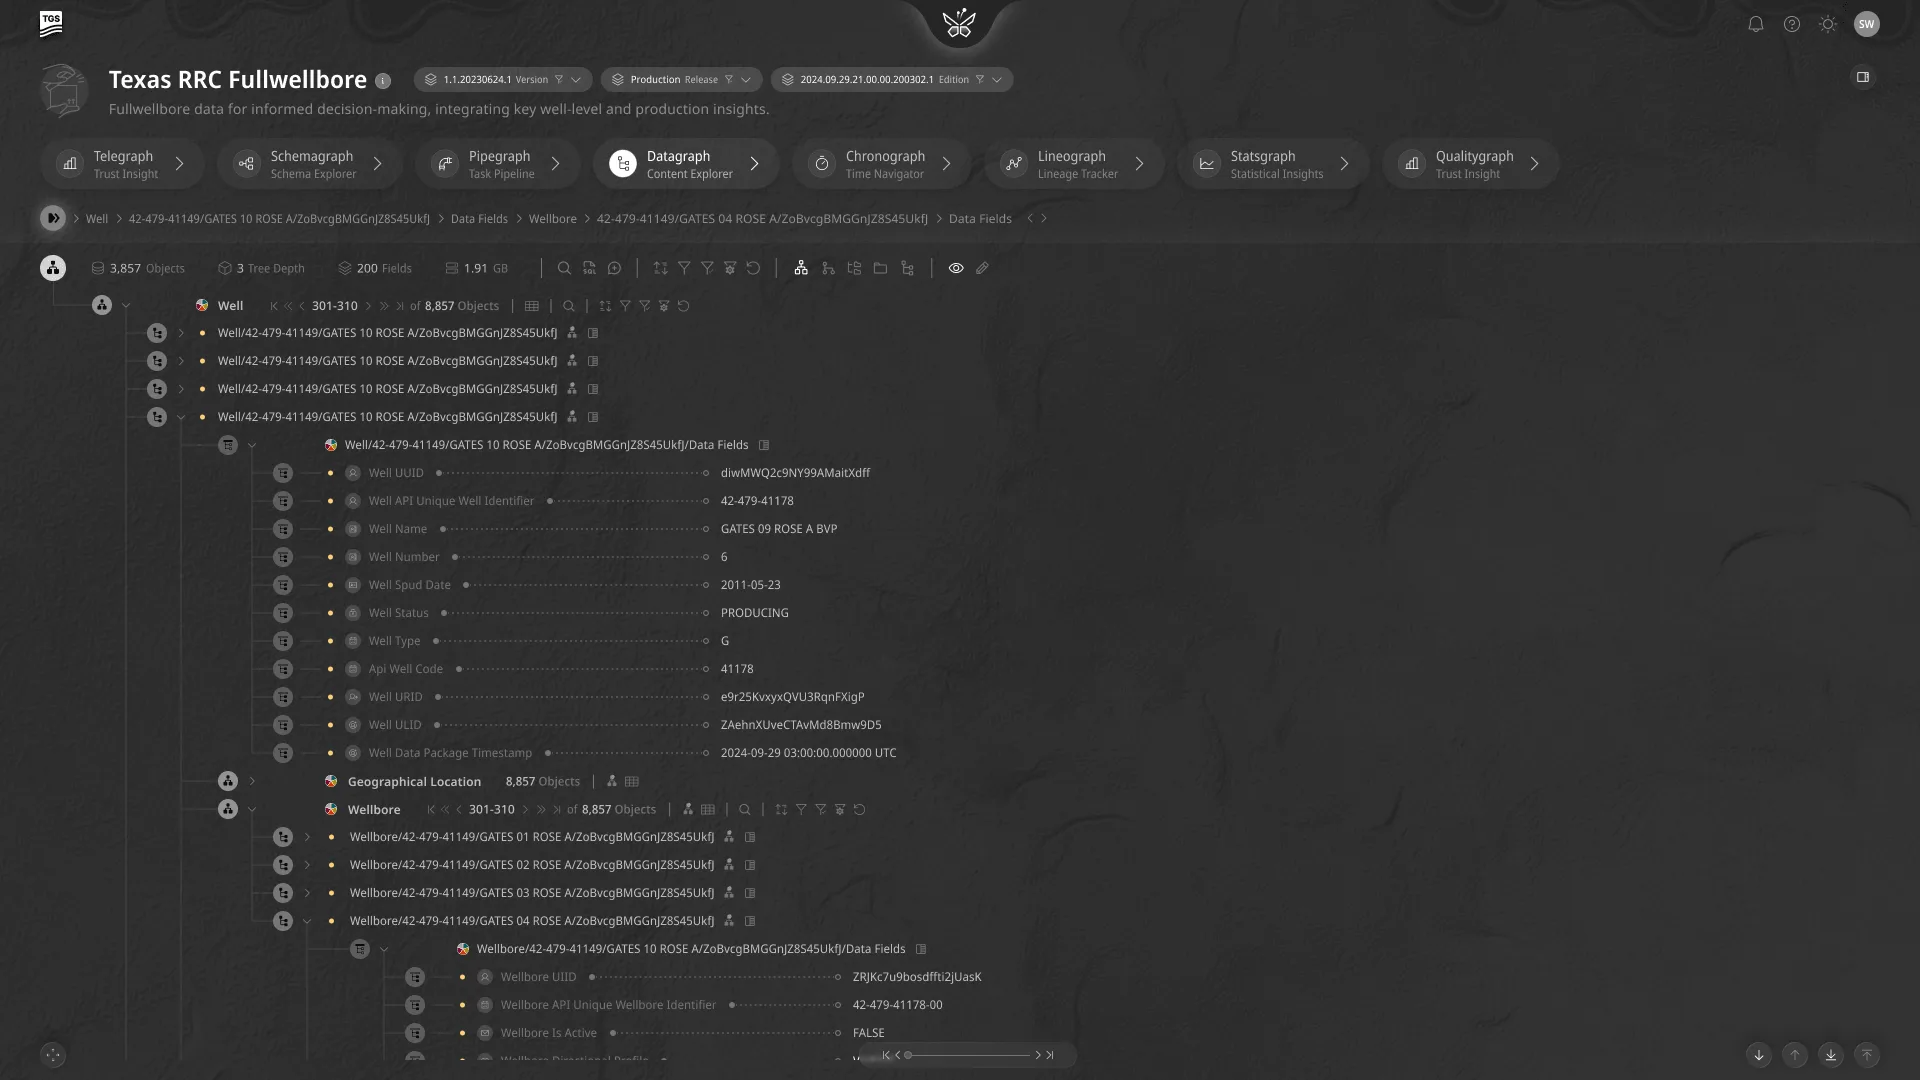
We noticed: understanding one dataset meant opening several tools. So every product gets a lens bar, like switching between map, satellite and traffic views of the same place. Structure, pipelines, data, history, lineage, stats and quality are all one click away.
We noticed: lineage lived in engineers' heads and in diagrams that were out of date the day they were drawn. So where the data comes from, the product itself, and who uses it sit side by side, and the impact of a change is visible at a glance.
We noticed: every question meant writing SQL, or waiting for someone who could. So a query board and an AI chat sit right beside the data. Engineers write SQL, business users ask in plain English, and both work in the same place.
We noticed: nobody could see how products, teams and organisations connected across the company. So a network graph shows the whole chain, a bit like an airline route map, with product details in a side panel. Light and dark themes support both presentations and long analysis sessions.
Engineers needed depth; business users needed clarity. The challenge was serving both on the same screens, without quietly building two separate products.
Symbiontra gives every data product a home: a place where business and engineering teams alike can find it, understand it, trace it and question it.
This time, he doesn't need to ask anyone.
The product card shows the current version, who publishes it and how usable it is.
He sees it before it reaches his report, not after.
Right beside the data, with no SQL needed.
Daniel never had to open a ticket.
Browse data products the way you'd browse an online shop. Every card shows who publishes it, which version it is and how usable it is. Open one to see its details, its metrics, and what it depends on.
Fixes“I can't tell which datasets exist, or which version to trust.”
The Datagraph explorer shows a product's structure and fields. Split views put details side by side, and a table view shows how the values in each column are spread.
Fixes“To understand one dataset, I jump between several tools.”
Lineography lays out where each product's data comes from and who uses it. The network graph zooms out to show how everything connects across teams.
FixesReports breaking silently when a source changes
A query board and an AI chat sit beside the data, so engineers can write SQL and business users can simply ask, in the same place.
Fixes“Every new question means writing SQL, or asking someone who can.”
Symbiontra was designed to change who can work with data, and how much they have to ask for help. These are the outcomes it was built around.
Complex, technical data work shown through visual, product-centred views that business users can understand.
Both groups find, trace and question the same data products in the same place, instead of passing tickets back and forth.
Company-wide governance and transparency, while each team keeps ownership of its own data.
Remember Daniel? “I own this data, but I still need an engineer to tell me who uses it and what feeds it.” Symbiontra was designed so he never has to ask.
Symbiontra gave a Data Mesh something it usually lacks: one shared place to work. Organising everything around the data product, and giving every product the same set of lenses, made complex data feel navigable for business and engineering teams alike.
Making the data product the main thing on screen simplified every other navigation decision.
Engineers kept all their detail; business users got friendlier views of the same data. Nobody needed a separate tool.
Lineage and network views answered “what depends on this?” faster than any list could.